Statistics

ANALYSIS OF CERTIFIED EXPORTS
Introduction
Certified exports over the period January 1 to February 11 of the years 2016 to 2022 were summarised according to the three (3) pillars. For the most part, the classification according to pillar has been done at the level of the exporter. The results have been graphically presented.
Certified exports were valued at US$18.3 million over the period January 1 to February 11, 2022, increasing by 28.8% compared to the previous year. Exports for the corresponding period of 2024 are forecast to fall by 12.2% to US$16 million, based on the trend over the past four years.
Exports from the Bio-Economy over the review period generated the largest share of foreign exchange, accounting for US$14.6 million in exports in 2022, an increase of 43.2%. Shipments in the Design Economy were valued at US$3.5 million in 2022, a decrease of 8.6%, while exports in the Ocean Economy increased by 10.9% to US$134,936 in 2022.
Current trend forecasts suggest that Bio-Economy exports should fall by 16.9% in the next two years to reach US$12.1 million. Exports from the Design Economy are projected to reach US$3.8 million in 2024, growing by 6.3%, while exports in the Ocean Economy should reach US$0.1 million an increase of 13.6% over the same period (see Figure 1).

Certified exporters have been ranked by tier according to their value of exports in 2020. Tier 1 refers to companies with at least US$10 million in exports; Tier 2, those that exported between US$5 million and US$10 million; Tier 3, companies that exported between US$1 million and US$5 million; Tier 4, companies with US$150,000 to US$1 million in exports; and Tier 5, companies whose exports were less than US$150,000.
Companies in Tier 1 accounted for certified exports valued at US$8.2 million over the period January 1 to February 11, 2022, increasing by 45.8% compared to the previous year. Tier 2 and Tier 5 also recorded increases in exports of 38.5% (US$6.7 million) and 314% (US$0.8 million), respectively. Exports in Tier 3 and Tier 4 decreased by 31.8% and 10.4% to US$1.7 million and US$0.8 million respectively.
Tier 1 companies accounted for 44.8% of certified exports for the review period, increasing by 5.1% while exporters in Tier 2 had a share of 36.7%, an increase of 2.5%. Tier 3’s share reached 9.5% while Tier 4’s share reached 4.6%, a decrease of 8.5% and 2.0% respectively. Tier 5’s share reached 4.4%, an increase of 3.0%. Forecasts suggest that exports should fall in Tier 1, Tier 2, Tier 4, and Tier 5 over the next two years. Exports from Tier 1 are expected to reach US$7.2 million, falling by 11.8%, while exports from Tier 2 are expected to reach US$5.4 million, decreasing by 19.7%. Exports from Tier 4 are expected to reach US$0.7 million, decreasing by 20.9%, and exports from Tier 5 are expected to reach US$0.6 million, decreasing by 23.6%. However, an increase of 33.3% to US$2.3 million is anticipated in Tier 3. (see Figure 2).

A summary of the overall performance of certified exports for the Bio-Economy is presented in key points while the performance in selected segments is also highlighted.
Key Points for January 1 to February 11, 2022
- Certified exports were valued at US$14.6 million, increasing by 43.2%
- Shipments were made to 25 markets by 44 companies
- Jamaica, The United States of America, and Trinidad and Tobago, were the largest markets, accounting for US$3.8 million (25.7%), US$2.6 million (17.8%) and US$1.7 million (12%) respectively
- CARICOM was the largest region, accounting for US$10 million or 68.4%
- The largest exporter was The West Indies Rum Distillery Ltd., accounting for US$2.6 million or 18%

Alcoholic Beverages
The Alcoholic Beverages segment was the principal export category in the Bio-Economy over the review period. Local producers sent shipments valued at US$4.3 million to 16 markets during 2022, an increase of 54.6% compared to the previous year. The United States of America (49.2%), Canada (21.9%) and France (9.9%) were the principal destinations. France, Canada, and The United States of America registered increases of 140.2%, 121.0% and 64.4% respectively.
Projections based on current trends suggest that this segment will earn US$3.6 million for the review period in 2024, falling by 15.9%.

Baked Goods
Certified exports of Baked Goods were valued at US$1.2 million during 2022, an increase of 27.2% for the same period of the previous year. The United States of America was the principal destination among the 13 markets, receiving 30.5% of the shipments during 2022. These shipments were valued at US$0.4 million for the review period.
The projections based on current trends suggest that this segment will earn US$1.1 million for the review period in 2024, decreasing by 3.3%.
Aerosols/Insecticides
Certified exports of Aerosols/Insecticides recorded for the period January 1 to February 11, 2022 were valued at US$0.5 million, decreasing by 0.9% compared to the figure recorded for the same period of the previous year. Shipments were sent to St. Lucia, Guyana, Trinidad and Tobago, Antigua & Barbuda, St. Kitts and Nevis, Suriname, and the Dominican Republic, with St. Lucia accounting for 24.8%, Guyana 19.9%, Trinidad and Tobago 17.1%, Antigua & Barbuda 11.6%, St, Kitts and Nevis 11%, Suriname 9.6% and the Dominican Republic 6.1%.
Projections for the next two years suggest that if current trends continue, this segment will earn US$0.6 million for the corresponding period in 2024, an increase of 4.1%

Primary Products
Over the review period in 2022, the exports of live animals were valued at US$0.1 million, decreasing by 11.1%. Grenada and Trinidad and Tobago were the primary markets receiving exports valued at US$61,687 (47.4%) and US$27,014 (20.8%), respectively.
Agricultural produce exports were valued at US$10,616 for 2022. This was more than four times the exports recorded for the same period of the previous year. St. Vincent and the Grenadines and St. Lucia were the only two markets to which produce were exported. St. Vincent and the Grenadines received exports valued at US$8,704, while exports received by St. Lucia were valued at US$1,913.

Other Segments
Positive performances were recorded in exports of Non-alcoholic Beverages, Plastics, Other Chemicals, and Pharmaceuticals, which grew by 645.7%, 520.1%, 276% and 154.9%, respectively. There were also increases in the exports of Petroleum/Petroleum Products (62.4%), Juices/Juice Drinks (57.5%), Other Food (30.7%), Printed Materials/Stationery (21.8%), and Snacks (4.7%).
However, there were declines in Misc. Bio-Economy Products (81.7%), Lenses (69.1%), Paints/Varnishes (54%), Fats/Oils (21.4%), Clothing (10.4%), Seasonings/Sauces (9.9%). and Milk Products (6.7%).
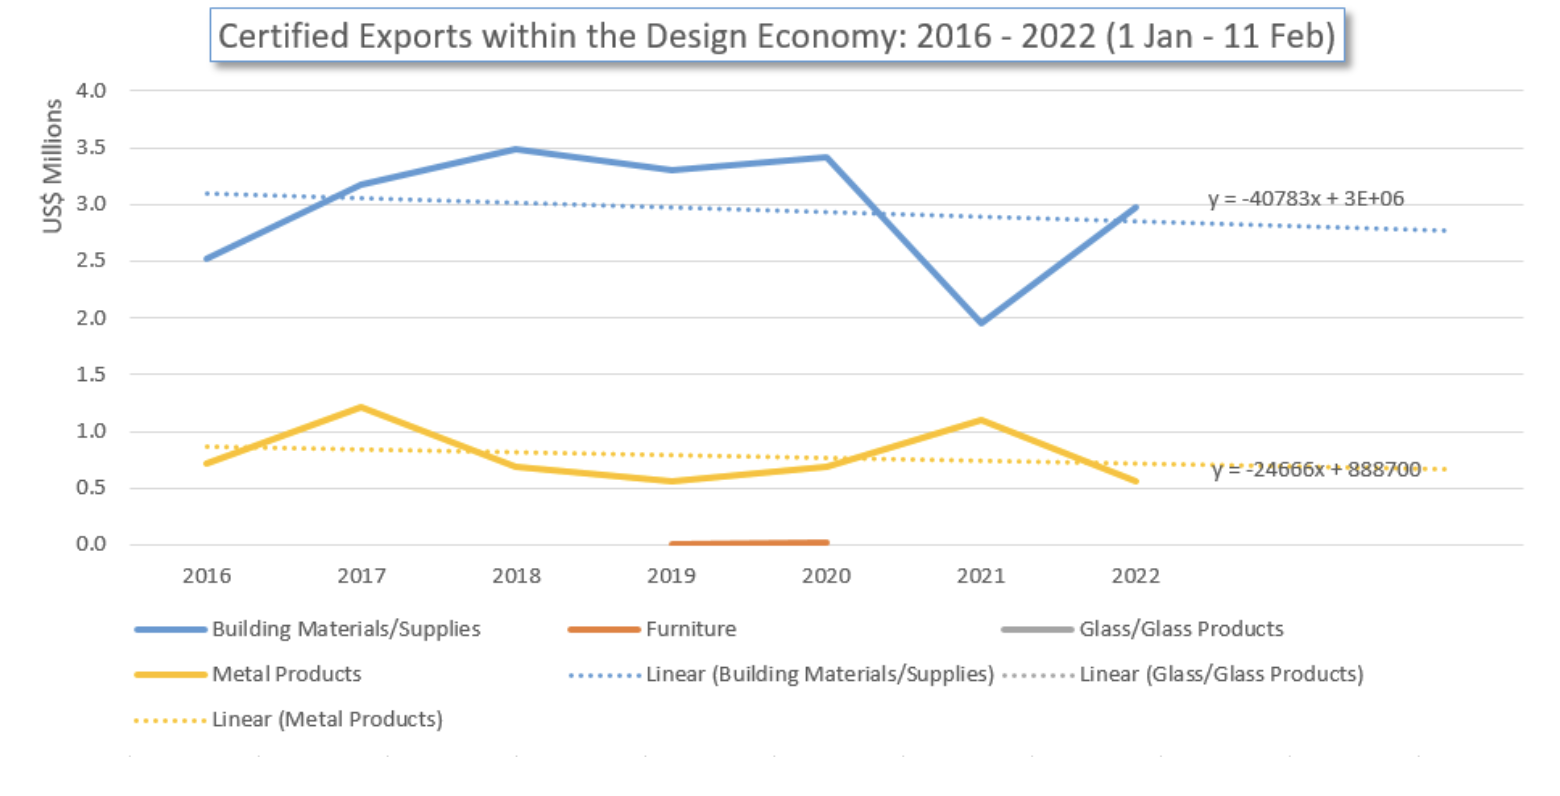
The Design Economy comprises the segments Building Materials/Supplies; Furniture; Glass/Glass Products; Metal Products; Miscellaneous Design Economy Products, Resistors, Sculptures/Paintings/Souvenirs and Signs/Plaques/Decals.
Key Points for January 1 – February 11,2022
- Certified exports were valued at US$3.5 million, a decrease of 8.6%
- Shipments were made to 10 markets by 11 companies
- Guyana was the largest market, accounting for US$1.8 million or 49.5%
- CARICOM was the only region to which exports were recorded.
- The largest exporter was Arawak Cement Co. Ltd., accounting for US$1.7 million (48.2%)
- Building Materials/Supplies
Certified exports of Building Materials/Supplies for the period January 1 to February 11, 2022 were valued at US$3 million, accounting for 84.0% of the exports under this pillar. Exports for the review period increased by 52.1%.
Producers sent shipments to 9 markets, with Guyana (58.9%) and Grenada (16.9%) being the two main export markets. Certified exports to Guyana were valued at US$1.8 million, an increase of 38.4%, whilst exports to Grenada were valued at US$0.5 million, which is more than fifteen times the value for the same period in the previous year. Shipments were also made to Trinidad and Tobago (US$0.3 million) and St. Lucia (US$0.2 million). An increase of 145.9% was also recorded in exports to Jamaica which received shipments valued at US$65,906.
Decreases in exports were recorded in Dominica (80.8%), Belize (42.6%), Antigua and Barbuda (13.1%) and St. Vincent and the Grenadines (9.0%). There were no exports to St. Kitts & Nevis.
The Ocean Economy is comprised of Marine Activity and Fish/Fish Products.
Marine exports for January 1 to February 11, 2022 increased by 18.7% compared to the corresponding period of the previous year. These exports totaled US$77,764. The United States of America was the only market to which shipments were made. Exports of Fish/Fish Products were valued at US$57,173, an increase of 1.9%. St. Lucia was the only market to which shipments were made.
Among the SIDS with which Barbados trades, CARICOM markets impacted significantly on the performance within the pillars. The following table isolates the impact of the major markets within SIDS on the broad pillars over the period January 1 to February 11, 2022 compared with the corresponding period of 2021.

The table below highlights the movements in each of the categories of the three pillars over the period January 1 to February 11, 2022 compared with the corresponding period of 2021.

The CARICOM market continues to be the principal destination for Barbadian goods. For the period January 1 to February 11, 2022, Barbadian exporters shipped US$13.6 million, an increase of 31.6%. This represents 74.3% of all certified exports, which is an increase in share of 1.5% compared to the corresponding period of the previous year.
Projections based on current trends suggest that certified exports to CARICOM should reach US$11.9 million for the corresponding period of 2024, falling by 12.6% over the next two years.

For the review period, Jamaica, Guyana, and Trinidad and Tobago were the principal destinations for Barbadian certified exports to CARICOM, accounting for 32.2%, 21.6%, and 14.8% respectively. Exports to Jamaica, Guyana, and Trinidad and Tobago, increased by 47.9%, 29.3%, and 19.1% respectively to US$4.4 million, US$2.9 million and US$2.0 million.
Increases were also recorded in Grenada, St’ Kitts and Nevis, St. Lucia, Montserrat and Suriname. However, Antigua & Barbuda, Anguilla, Belize, Dominica and St. Vincent and the Grenadines recorded decreases over the review period.
